Warning signs of a stock market crash
Unless it’s a force majeure like a meteorite or a pandemic, the market usually provides warning signs months and even years before every serious stock market crash.
The problem is that the majority of people don’t know about these signals. And many of those who know often ignore them until it’s too late. Like it happened again in the stock market crash of 2022.
In this article, you’ll uncover a couple of indicators that most beginner investors and traders don’t know about.
These market prediction tools are not only useful for gauging the probability of a future market crash. They can also be used to predict the possible depth of an economic decline as it is starting to form.
The “Two-year-old BMW sales” indicator

Every decent market watcher knows that vehicle sales are a great indicator of what’s happening with the economy and that declining car sales can be a signal for an incoming stock market decline.
Unfortunately, you can’t have an edge if you’re using a signal that is used by everyone else.
The second problem is that the data on vehicle sales is a lagging indicator. It means that you’ll likely get the public statistics that are only published at the end of each quarter.
And by the time you read the statistics, the market will already have plunged and it will be too late to save you from losses or to buy before others.
So how do the sneaky hedge funds get the necessary signals before everyone else? One unorthodox method is to use what we call the “Two-year-old BMW sales” indicator. This indicator analyzes the dynamics of used vehicle sale listings.
For example, if there is a sharp increase in the listings of two to three-year-old BMWs, Mercedes, or other luxury cars, it could be a sign that people are starting to have difficulties paying their leasing bills.
You can learn the other 9 shady strategies of hedge funds in this article.
People don’t sell their new BMWs en masse only two years after buying them… unless they are having financial difficulties.
The good part is that such information is public and live. You just need to learn how to scrape websites. For example, we did a small experiment in our Three Investeers headquarters back in 2019.
We built a quick bot that crawls the #1 used vehicle site in our country to check the dynamics of new car sale listings.
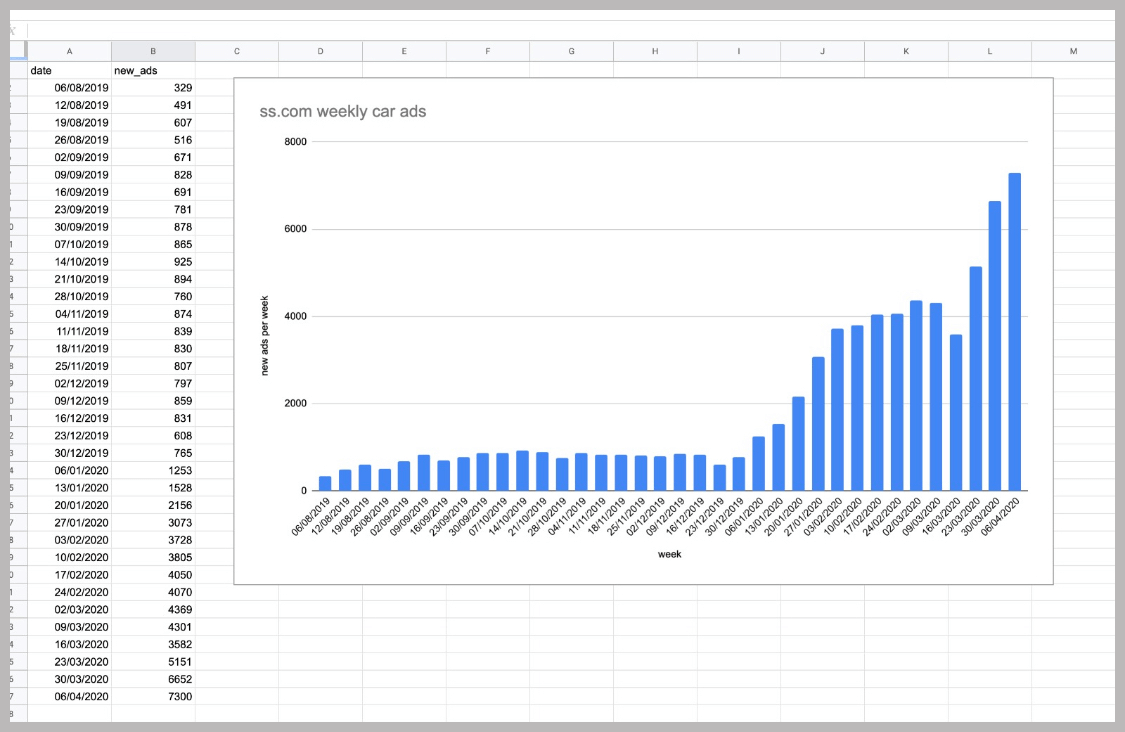
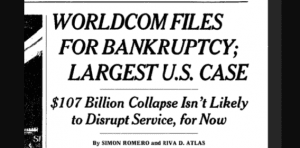
The little experiment confirmed that right before the global market crash, the listing count of used cars started to grow significantly.
As the pandemic took over people started to lose jobs, companies were afraid of the pandemics’ consequences and started selling their car inventories.
It’s quite certain that the big hedge funds have much more advanced scraping algorithms for a wide variety of sectors.
The Margin Debt Indicator
This indicator is one of the strongest predictors of possible market declines, yet it is relatively unknown among retail investors and traders.
Here’s how it works.
Many stock trading brokers allow their users to borrow money for trading. This is called leveraged trading or margin trading.
The maximum leverage that most brokers offer is 1:30. It means that if you deposit $1,000 you can make a trade worth $30,000. In this case, if your trade goes as planned your profit will be 30X bigger than without leverage. If the trade goes against you, your losses will be multiplied by 30X.
Leverage is a double-edged sword. The problem is that if many investors or traders are using leverage, it increases the risk of widespread financial wipeouts, which can put additional pressure on the economy.
As it turns out, there is a strong correlation between leveraged trading and stock market crashes. How can you get that info?
By looking at an indicator called Margin Debt levels, which FINRA publishes.
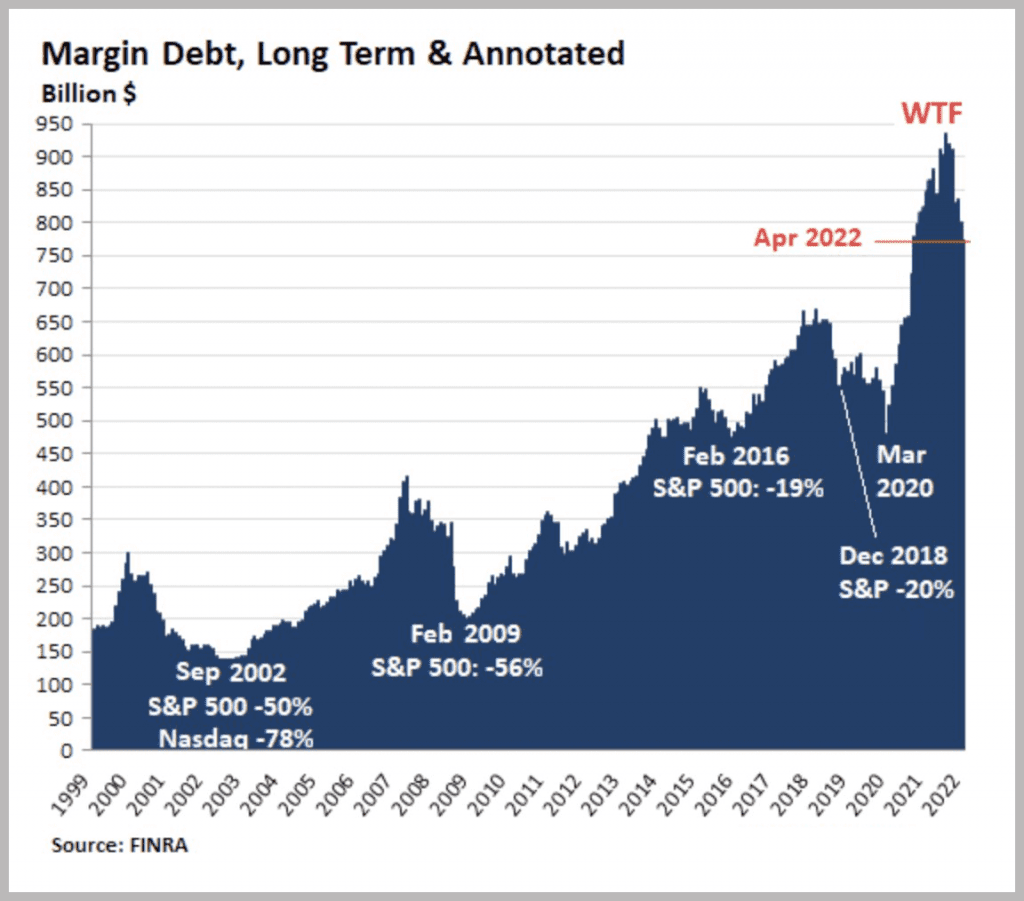
As you can see in the image above, there is a repeating pattern of soaring leveraged-trade levels quickly followed by sharp stock market declines.
It also indicates that in May 2022 the crash wave has just started to form, and looks likely to go further down.
Here’s a more detailed analysis:
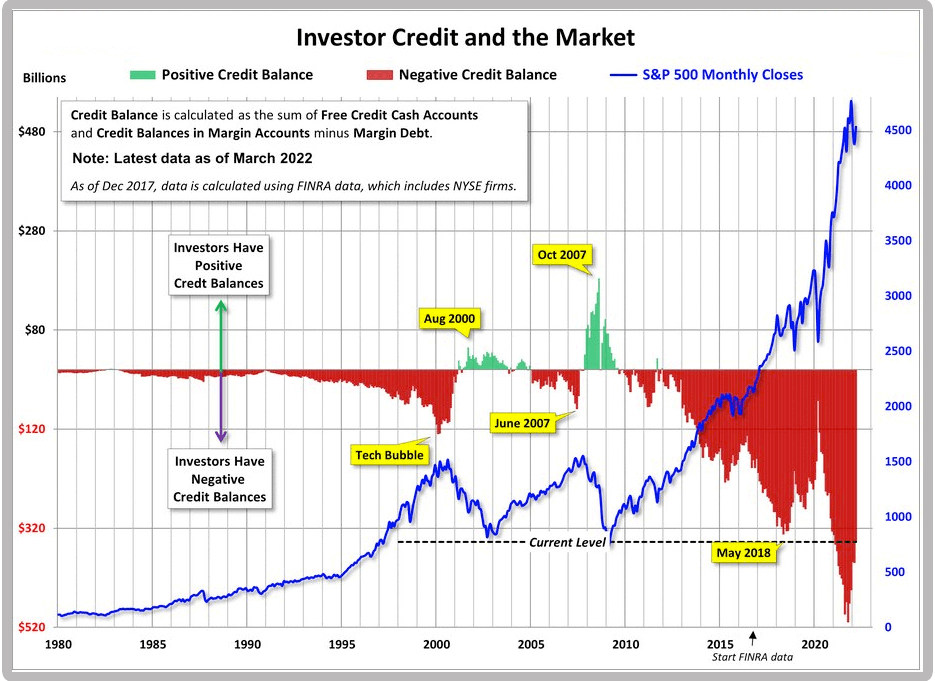
We can observe that the biggest crashes are usually followed by short periods of time when investors are cautious and do not use leverage (the green bars). Or brokers simply don’t allow them to.
The inverted yield curve indicator
Many market analysts read the inversion of the yield curve as a signal for an incoming recession because it has a decent track record of predicting market downturns.
***
All 10 recessions since 1955 have been preceded by an “inverted” yield curve (Source). That is the 3-month yield being higher than the 10-year yield.
***
Yield curve inversions and what they mean
Yield curves require a long and complex explanation, but here’s what you absolutely need to know:
When interest rates (yields) for short-term government bonds rise above the level of long-term yields, a recession is likely to follow within 2-3 years.
Let’s break it down in simple terms.
The US offers bonds when it needs more money. Selling a bond is basically borrowing money and paying interest (yield) to the buyer. When you buy a bond, you can’t access that money until the bond period ends.
Most bonds have different lengths. For example three months, one year, ten years, etc. Bonds have different interest rates (yields), proportional to their duration.
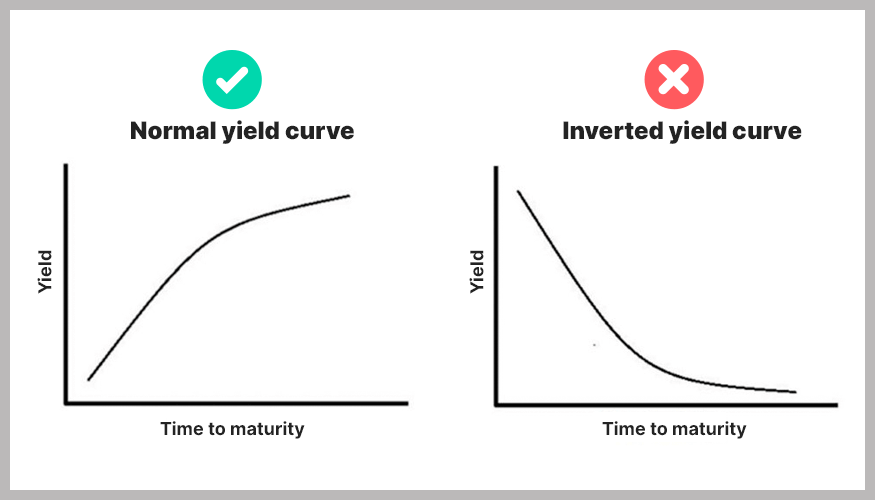
Normally, the yield curve, a line that measures the yields across all maturity lengths, slopes upward given the time value of money.
In a healthy market the longer the maturity of the government bond that you’ve purchased, the higher the interest you get paid.
This makes sense if you think about it. Freezing your money up for longer means you are less flexible in what you can invest in, and your money usually becomes less valuable over time because of inflation.
However, when the yield curve inverts, it means that interest rates go down the longer you tie your money up. This doesn’t make much sense and means that something is not right.
The curve inversion signals that the markets and investors think that something bad is about to happen with the economy in the short term.
They fear the economy’s growth will slow down, the government’s tax revenue will shrink (relative to expectations) and the US dollar will depreciate.
Example of a yield inversion process
For example, when investors fear a recession is about to happen in the short or mid-term (3-months to 5 years), they are likely to invest in long-term treasuries (5-10 years).
The yields of the bonds are dictated by supply and demand, so when many investors do that, it raises the price of the long-term bonds and pushes down the yield.
Why? If there is a big demand for a certain bond, the government can reduce the interest they pay to those who buy it. Investors will buy them anyway.
As a result, when enough of this happens, the long-term rates fall below the short-term rates.
Is this indicator bulletproof?
No. Just like any other indicator it can produce false signals and must be used in combination with other analysis tools.
For example, investors who sold their assets when the yield curve inverted on Dec. 14, 1988, missed a following 34% gain in the S&P 500 index.
The yield curve inverted also on 23 May 2019. If we disregard the Covid dip, the market had a record-breaking surge until 2022. Did the inversion foresee the covid crisis?
Most likely not. Was it signaling the crash of 2022? Could be, because it can take a long time for a proper crash to form.
Bottom line. Yield curve inversion is an important indicator to watch as it signals an increased chance of an incoming recession 2 – 3 years down the road. It can give false signals and if you stop buying stocks whenever you spot one, you can miss out on up to 3 years of gains, as you never know when exactly it will hit.
The Buffett Indicator
The Buffett Indicator is a widely used indicator that measures whether the stock market is under or overvalued. It was first proposed in 2001 by Warren Buffett, the legendary investor.
The concept of the Buffett indicator shows the total value of the US stock market compared to the country’s gross domestic product (GDP).
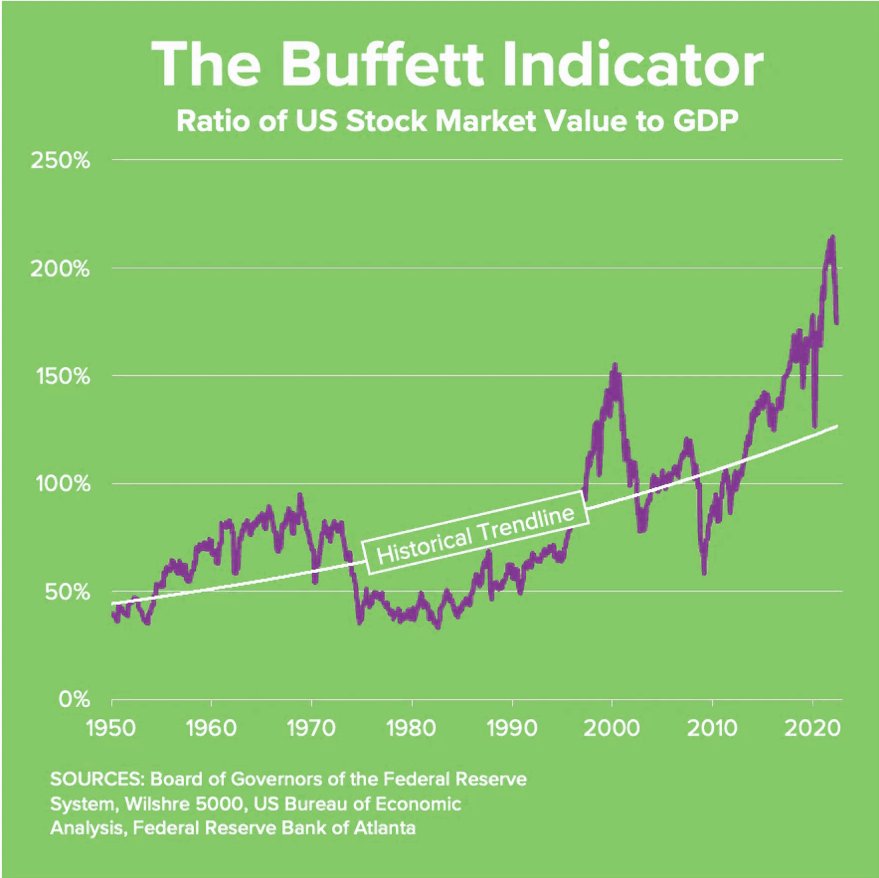
Currently, the Buffett indicator stands around 175%. According to Buffett’s metrics, this means that the market is significantly overvalued and poised for a further decline.
Here’s how Warren reads the indicator:
- A reading of 75% – 90% means the market is fairly valued.
- 90% – 115% indicate that the market is modestly overvalued
- 115% and more signals that the market is highly overvalued and prone to significant declines.
However (just like with any indicator), you have to take it with a grain of salt and use it together with other signals. The indicator has been above 115% since around 2015, yet the market kept on rising.
One of the possible explanations for why the market didn’t move according to the indicator is that the interest rates have been at their historic lows during that time.
As Warren Buffett himself has said:
“Interest rates act on financial valuations the way gravity acts on matter: The higher the rate, the greater the downward pull. That’s because the rates of return that investors need from any kind of investment are directly tied to the risk-free rate that they can earn from government securities. So if the government rate rises, the prices of all other investments must adjust downward, to a level that brings their expected rates of return into line. Conversely, if government interest rates fall, the move pushes the prices of all other investments upward.”
As we know, the FED has mentioned that it is likely to raise the interest rates in 2022 several times, thus it would add extra downward pressure on stock prices and the prediction of the Warren Indicator might start to materialize.
3 Key takeaways
- The markets always provide indicators if a significant decline is on the horizon. The problem is that these indicators don’t give the exact timing of the crash. You can see the indicators flashing red, but the actual collapse might start only two years after that. And ironically, the biggest stock market rallies usually happen right before the crashes, and it is very hard to stop investing in times of peak euphoria.
- You should never rely on a single indicator. Financial markets are influenced by thousands of factors, thus single indicators can sometimes give false or unprecise signals.
- If you want to practice predicting the stock market without any investment or risk you can use the free trading simulator we have built.
If you liked this article, feel free to share it with your friends. Sharing is caring.