Has the stock market crash 2022 already started?
Many financial analysts started to fear a stock market crash already in 2018.
Yet the market kept on reaching new highs…
Until the stock market started to fall in May 2022 and various other concerning signals began to emerge.
Let’s take a closer look at these signals.
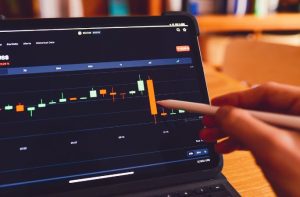
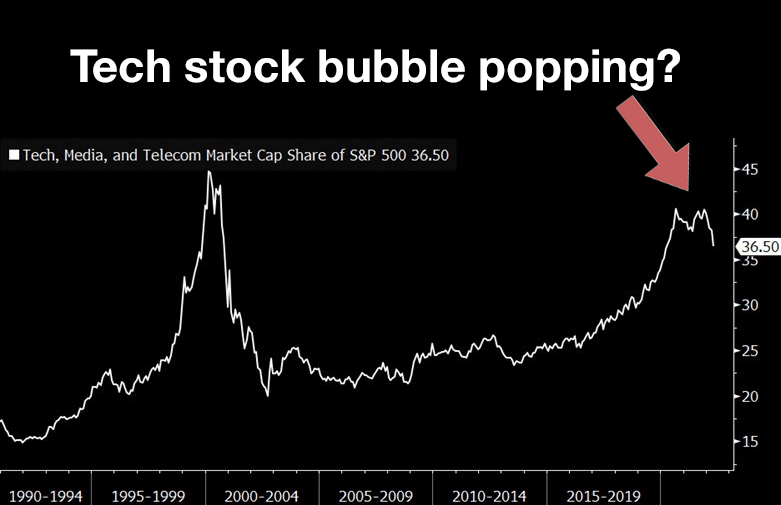
Tech stocks have started to fall
In May 2022, technology stocks started showing strong signs of an incoming downtrend.
Retail traders on WallStreetBets are going broke
An increasing number of retail traders are posting tragic stories of how they have lost all their life savings.
For example, one options trader managed to lose $1,102,893 in a week. Other forum users were applauding his conviction and the fact that he held on to his trades despite the heavy losses.
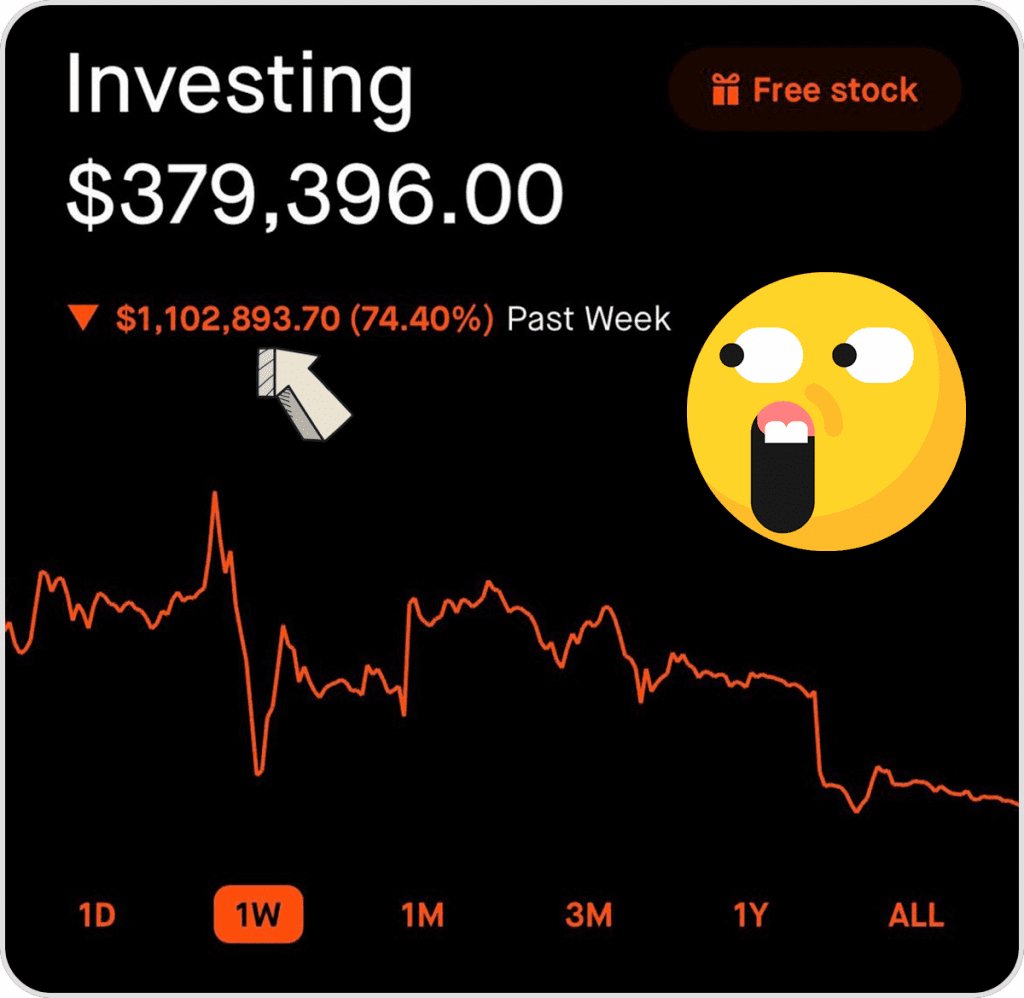
The trader still had $379,396 in his account, but that might be lost by the time you read this. You can read about other painful WallStreetBet losses in this article.
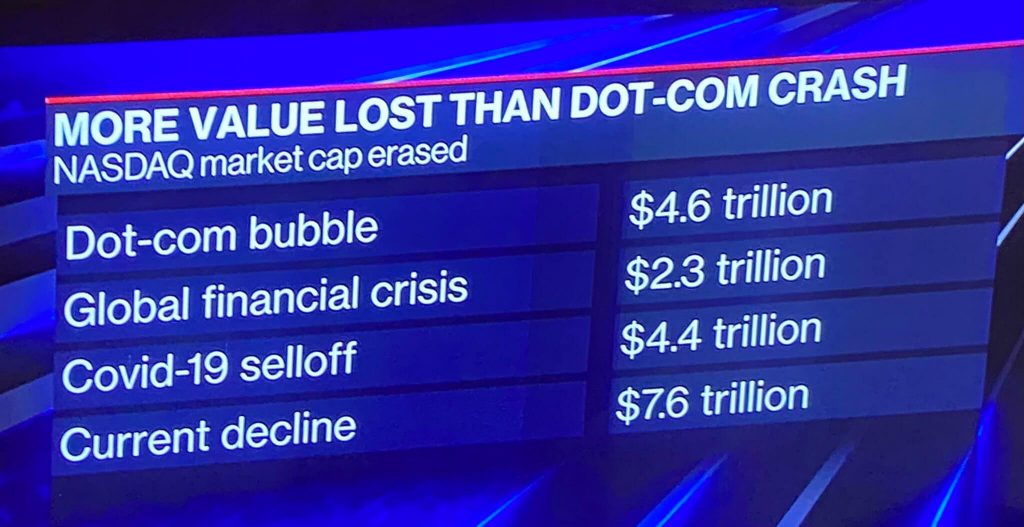
Nasdaq stock crash surpassed the dot-com bubble of 2000
In a matter of days, the Nasdaq stock market lost over $7 Trillion dollars, almost doubling the dot-com crash (If adjusted to inflation it could be similar, though).
Here’s what the situation looked like on May 13, 2022, compared to all the recent market crashes:
Do you remember the stock market crash of 2000?
To understand how this stock market crash might play out, it’s useful to understand how the previous crashes took shape.
This is what the dot-com bubble looked like for the pro traders who had a Bloomberg Terminal:
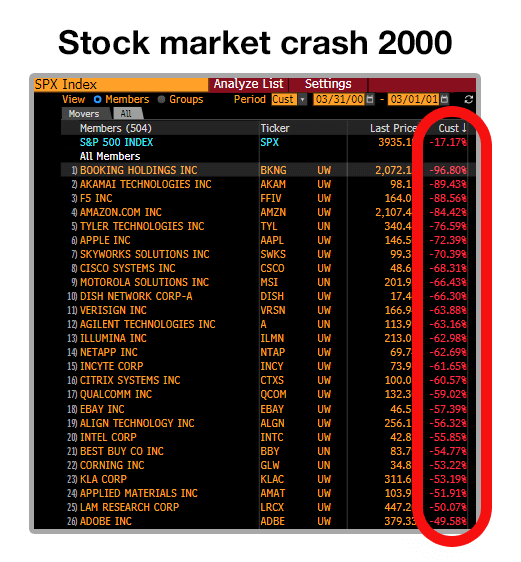
Do you see some familiar names on the list?
Amazon down -84%
Apple down -72%
That’s in a span of a month.
Of course, back in 1999 Amazon was a small startup in comparison to what it is today, so you shouldn’t expect it to fall as much as did back then.
Amazon stock crash 2000 Vs 2022
For the sake of fun, let’s take a deeper look at the crashes of Amazon stock.
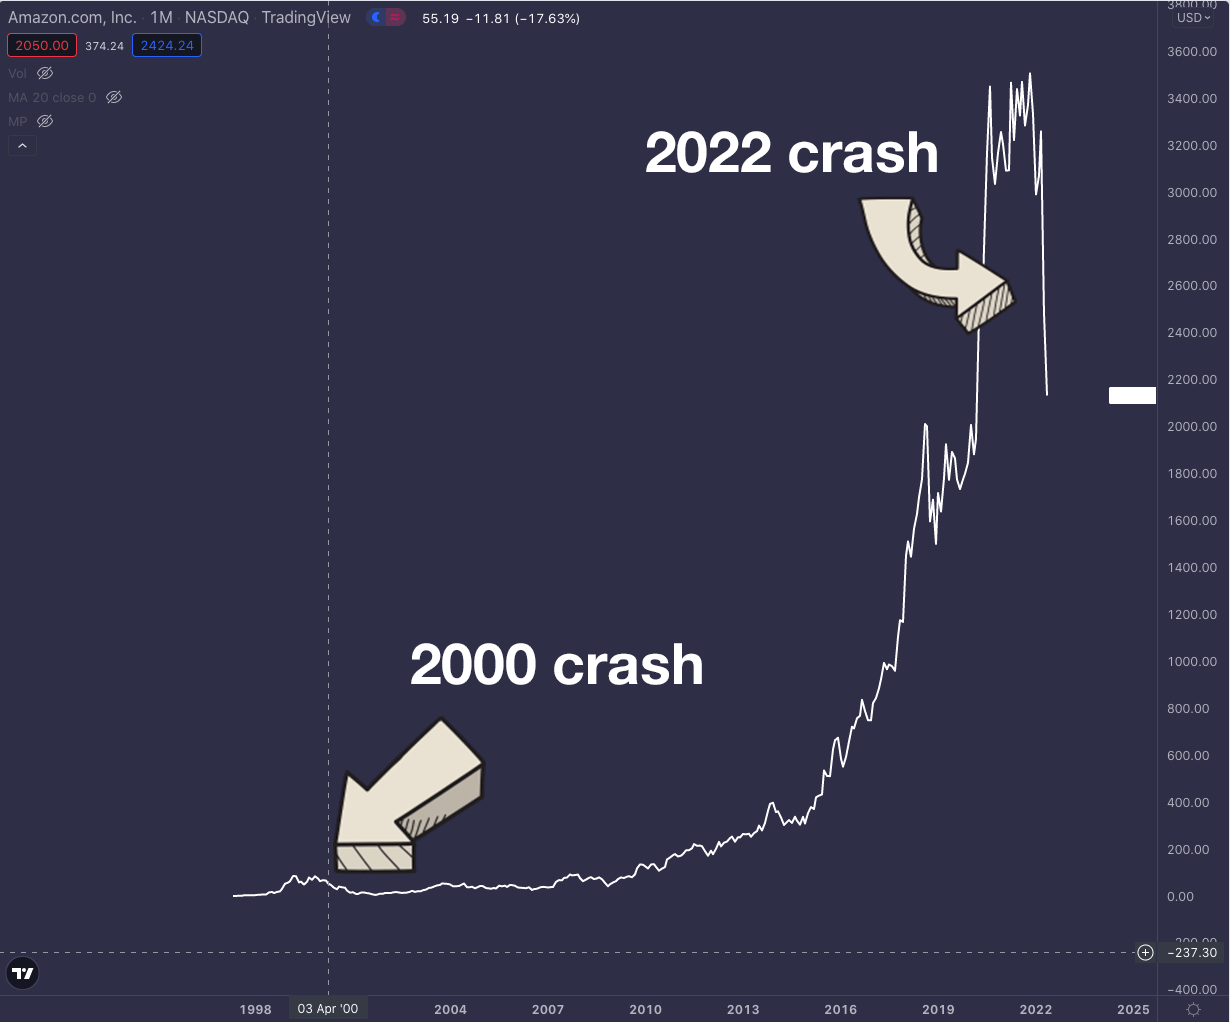
The crash of 2000 looks minuscule, right?
But it’s all relative and looks small because of the cosmic rise of recent years.
We need to compare the percentages.
Here are the loss % from the start of 2022:
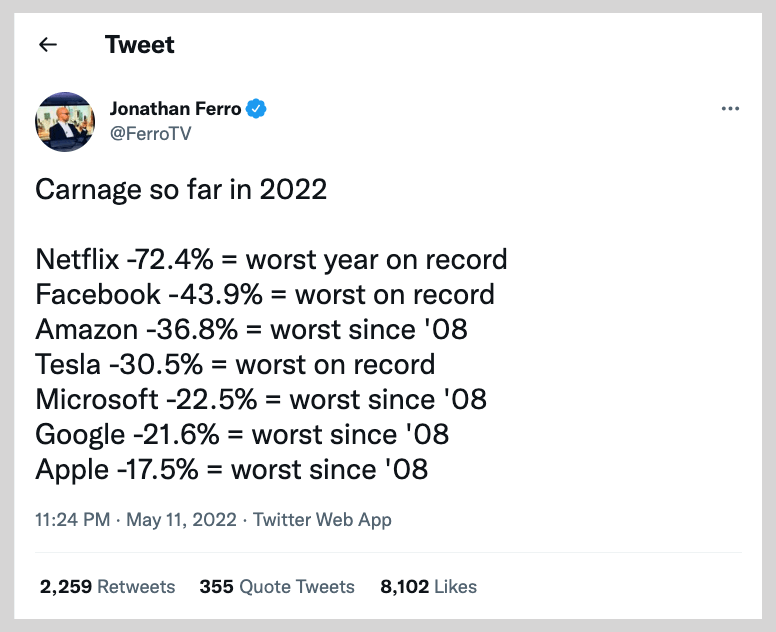
Amazon is down -36.8% compared to -84% in the crash of 2000.
What can we conclude from this?
Amazon and other biggest tech companies are much stronger than they were in the 2000s, so it’s not a given that they will fall as much.
Yet, there still might be more room for falling as the FED is just getting started with the tightening.
You can argue that the market has already priced in the rate hikes and tightening…
But has it fully?
Technical analysis, please step into my office!
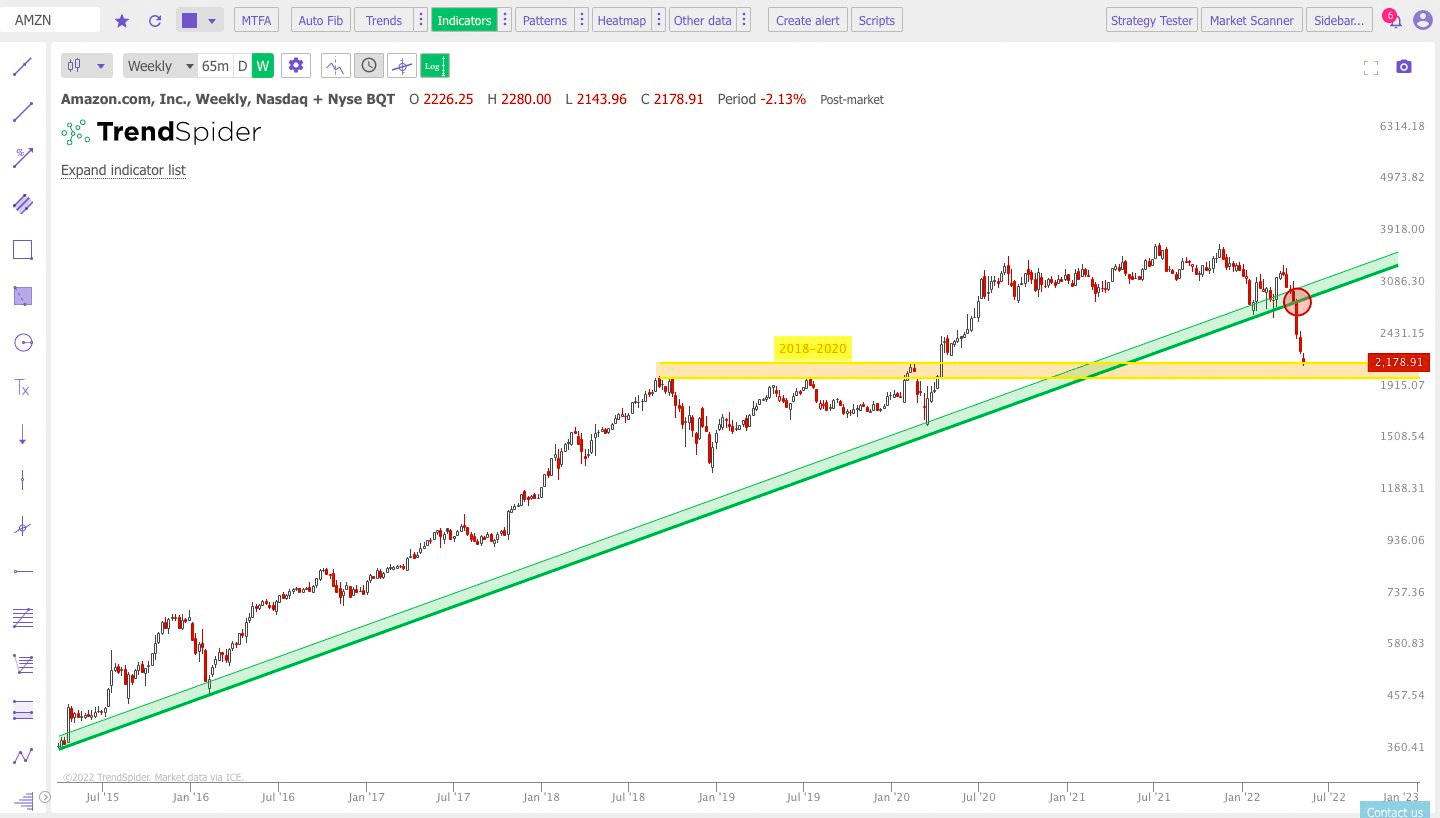
As you can see, Amazon’s stock price has just broken a long-term support zone.
It’s a major support which the price had respected and bounced against for more than 7 years.
And the price has waterfalled every week since. (Note the sequence of the long red candles after the breakout)
Plus, it is nearing an important previous resistance zone from 2018 to 2020. (The orange block)
It might stop and bounce there…
But it might also break it.
At this point, nobody really knows.
Mickey mouse is in trouble as well
There’s a similar story with Disney, its stock is also tanking.
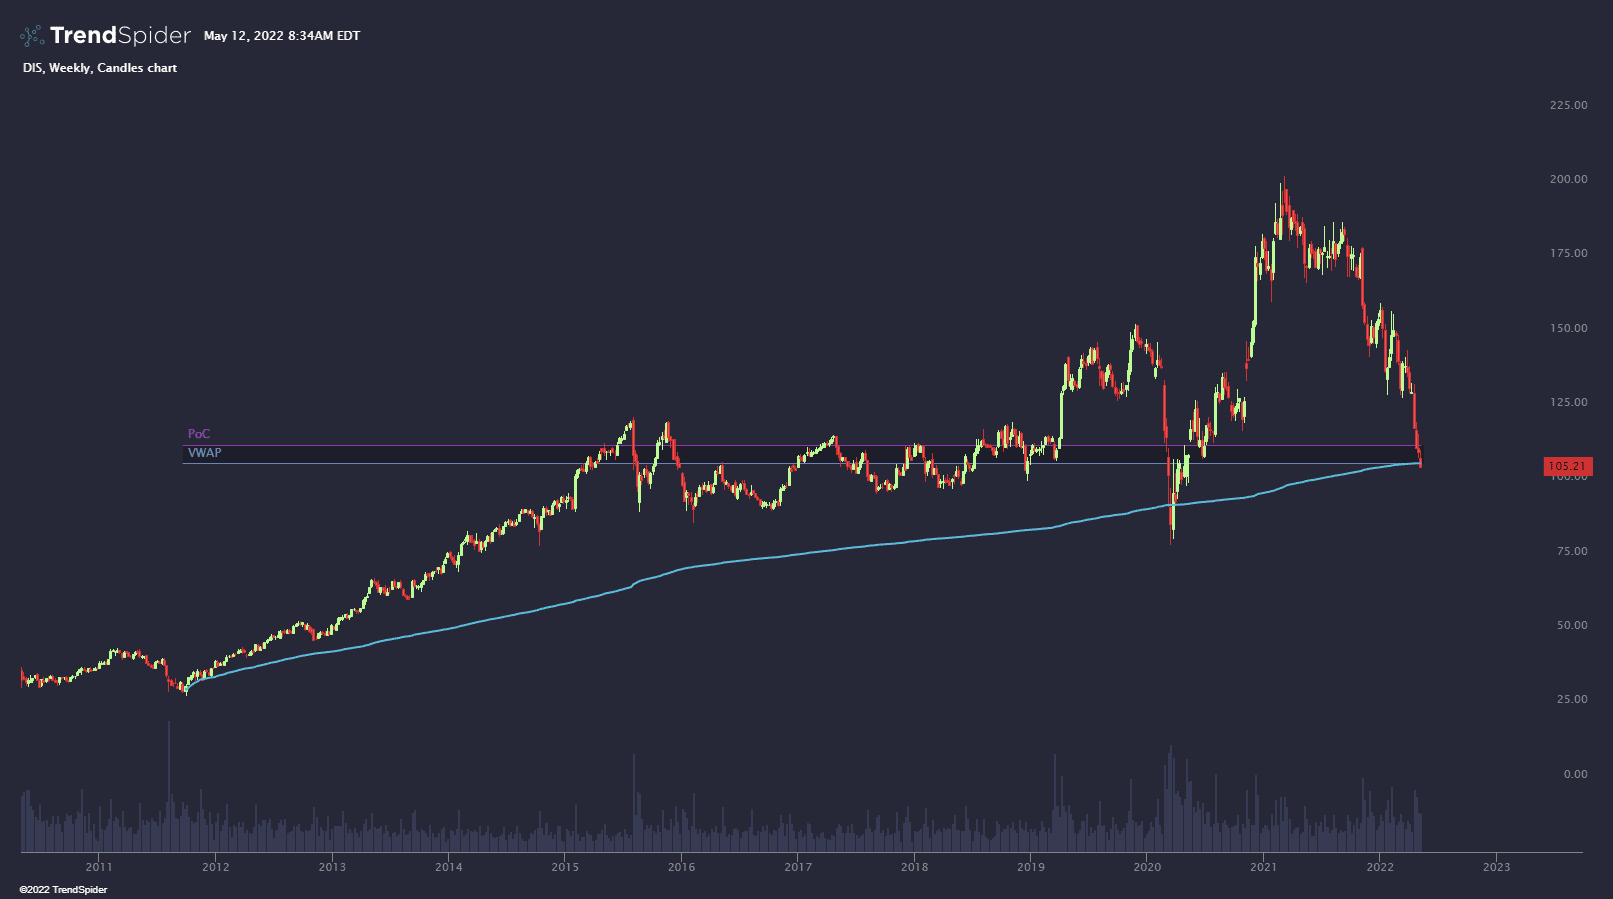
Disney stock price has dipped below a decade-long support in the form of VWAP.
VWAP is the volume-weighted average price.
It’s a statistic used by traders to determine what the average price is based on both price and volume.
It’s not good.
The mysterious loss pattern of Tesla
Now let’s look at your favorite stock – Tesla.
There is a strange annual pattern of Tesla stock that many don’t know.
For the last couple of years, TSLA has dropped about 50% in the first half of every year.
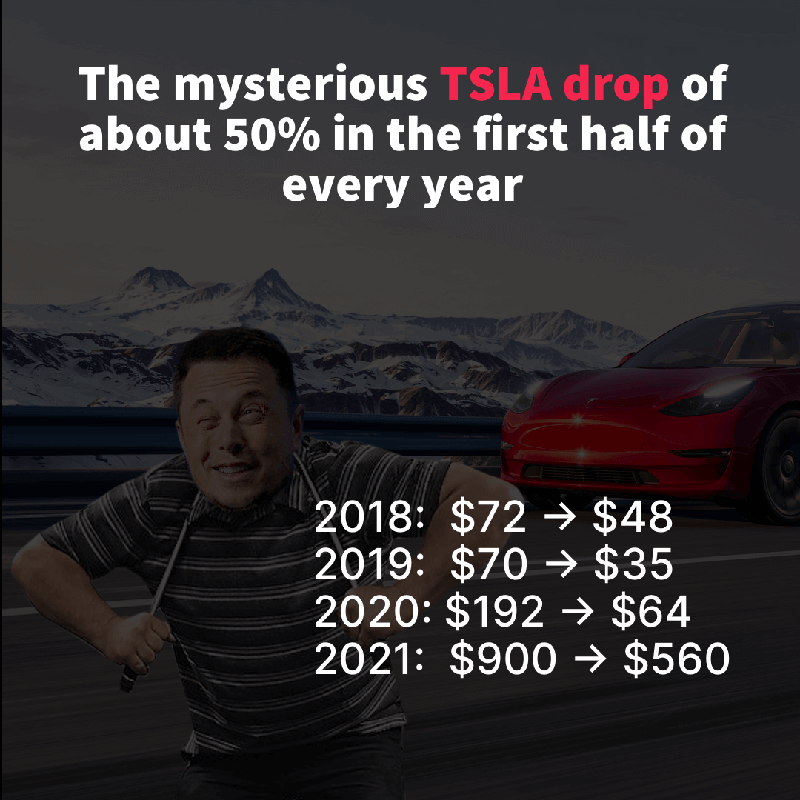
As you saw earlier, Tesla has lost about 30% this year.
Is it the initial phase of the annual 50% drop?
Most likely not…
…judging by the fact that the whole market is in a decline.
The September effect
By the way, such repeating patterns are not uncommon.
There is a broader Bermuda Triangle for stocks – the month of September:
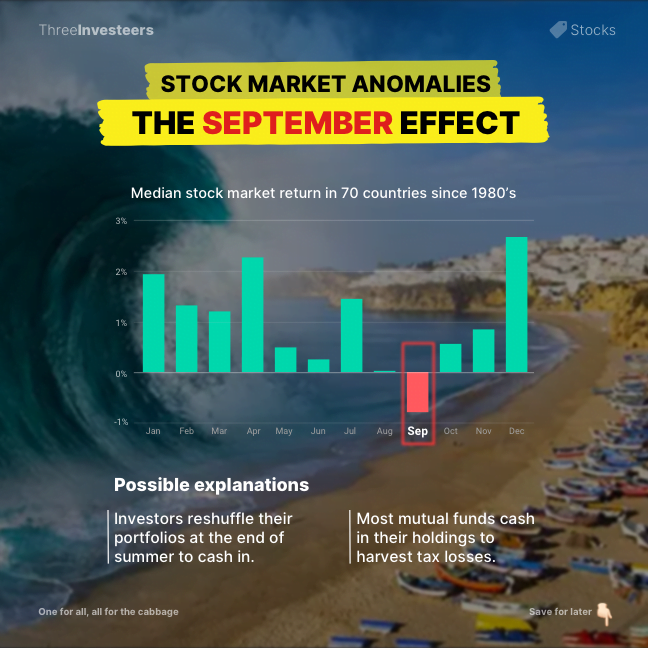
Let’s see what this September will bring.
The autumn and winter could be a cold one.
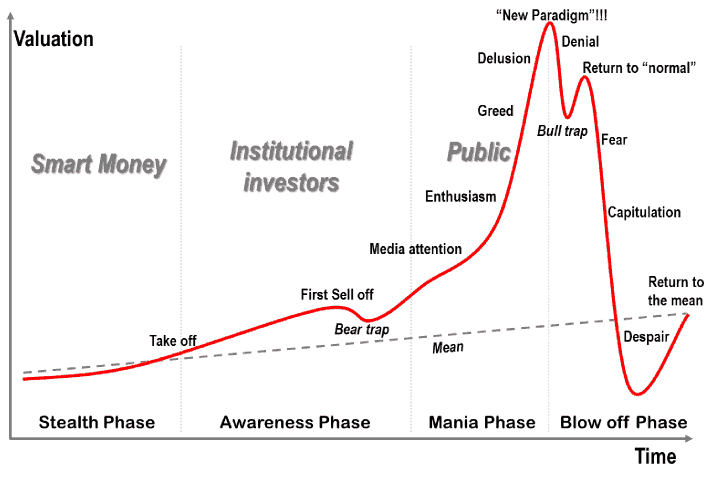
The 4 market phases and despair
Markets move in phases. And these phases repeat. Over and over again.
Here’s how it happens:
Unfortunately, many stocks are currently forming this exact pattern.
For example Shopify:
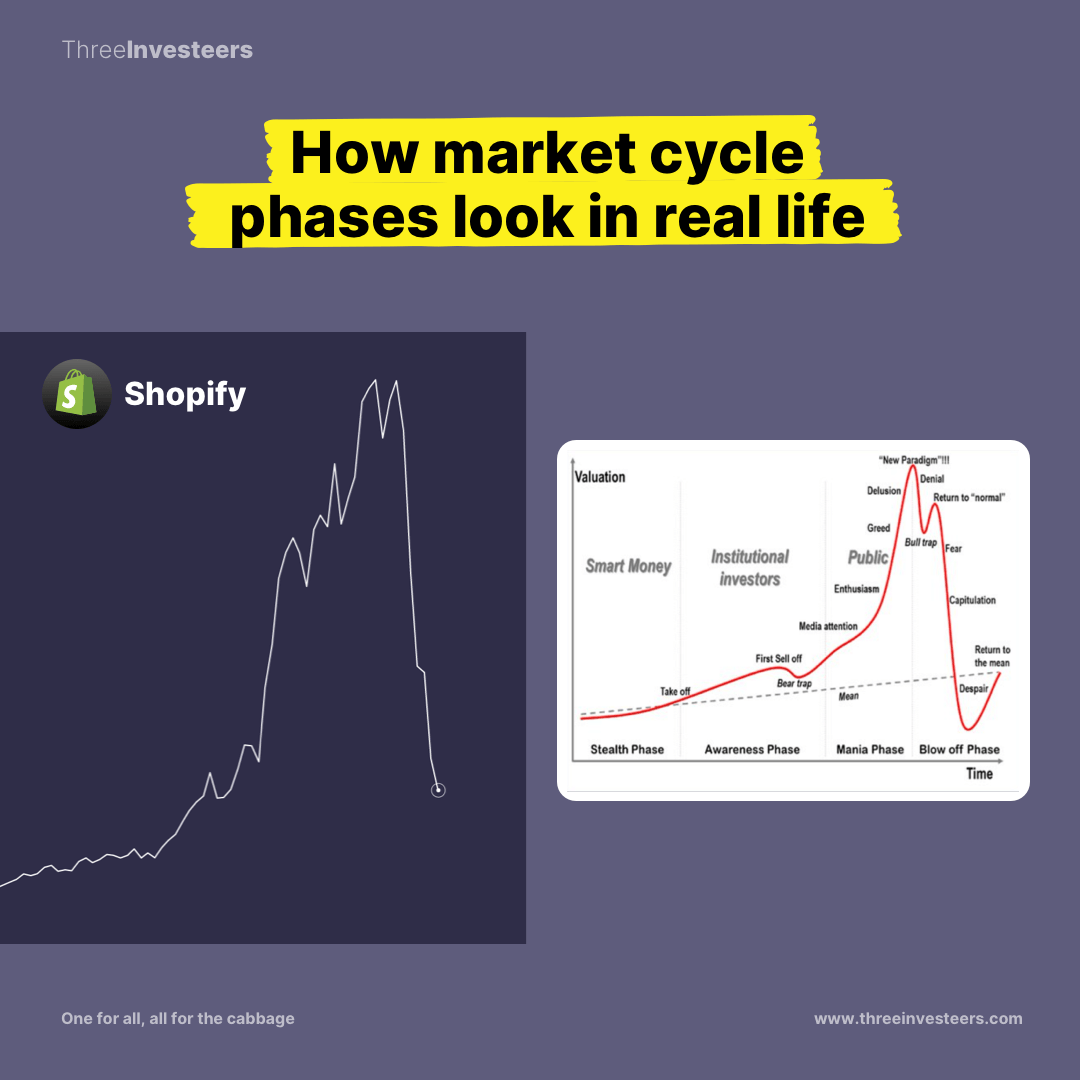
Can you tell what is the name of the current phase for Shopify?
Yep, it looks like DESPAIR.
Teladoc doing the same:
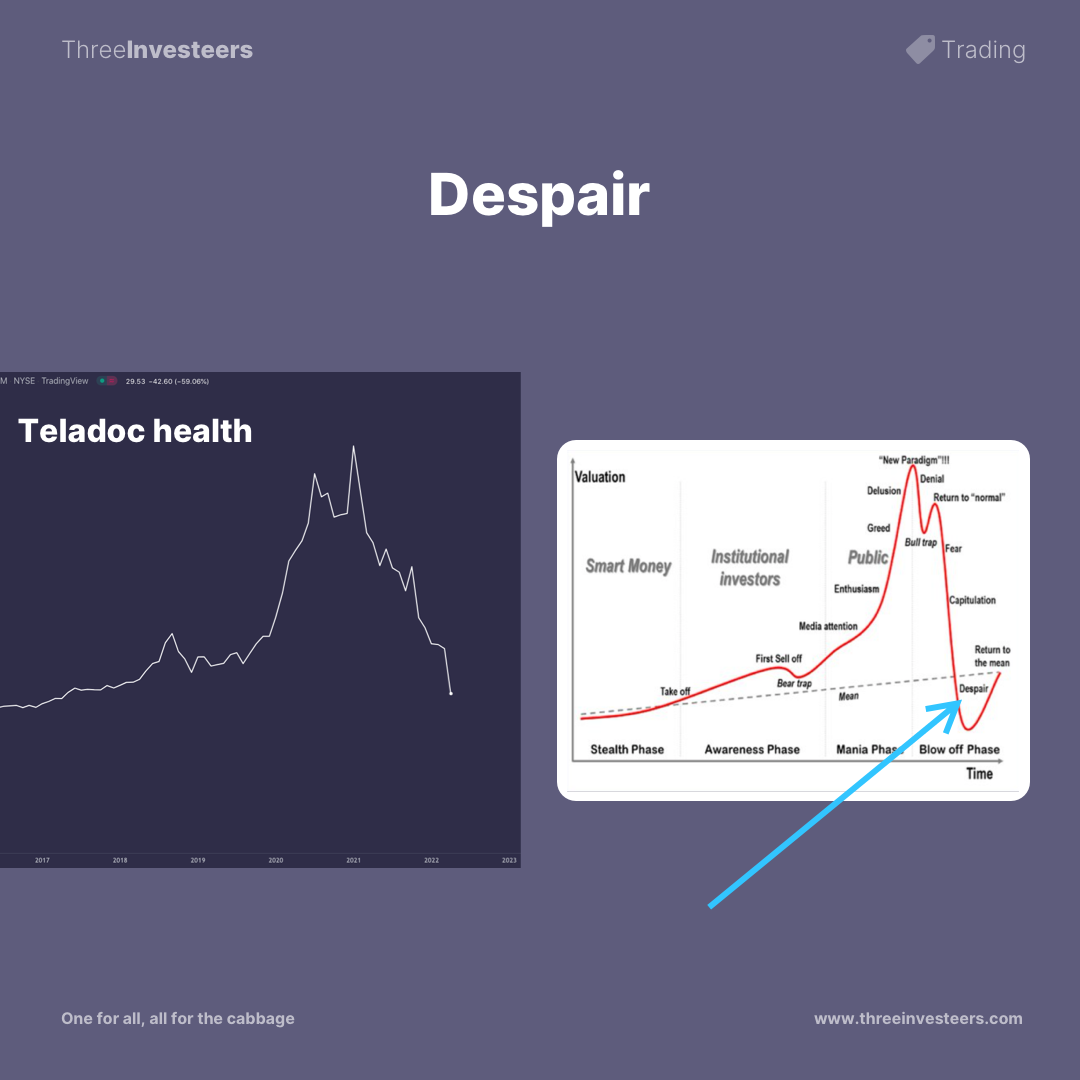
And there are many others also repeating the same pattern.
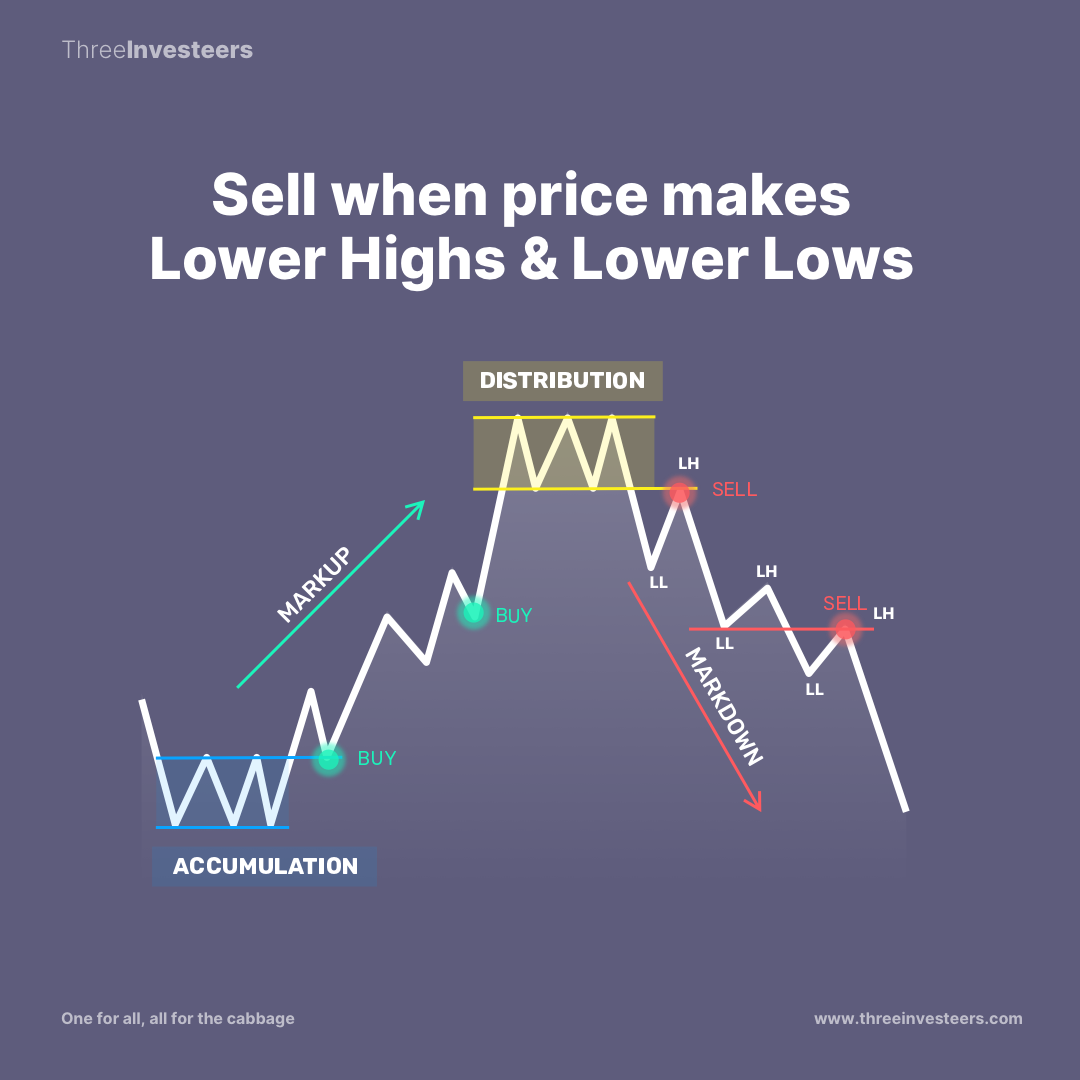
This is a great example of why you need to learn some price action theory.
Those who knew these basics, were selling at the distribution phase.
If you want to learn stuff like this, you might enjoy this trading and investing education app, which teaches you the principles and lets you practice trading with a stock trading simulator with zero risk.
9 reasons why the stock market crashes today?
- Rising inflation – too much money chasing a reducing number of goods.
- People plunging into more debt.
- Covid pandemic (Continuing Lockdowns in China) causing a global supply chain crisis.
- China’s economy is slowing down.
- The FED (the central bank of the US) starting to raise interest rates.
- Energy crisis with record-high natural gas and rising oil prices.
- China cracking down on its biggest tech stocks (Alibaba, Tencent, and others)
- Increased government spending.
- War in Ukraine
- Potential war in Taiwan.
- Crypto crash.
Let’s take a closer look at the most important ones.
Rising inflation
If the inflation rate continues to increase, it could negatively affect the stock market’s returns. Higher interest rates and lower economic growth would lead to lower dividends and lower stock prices.
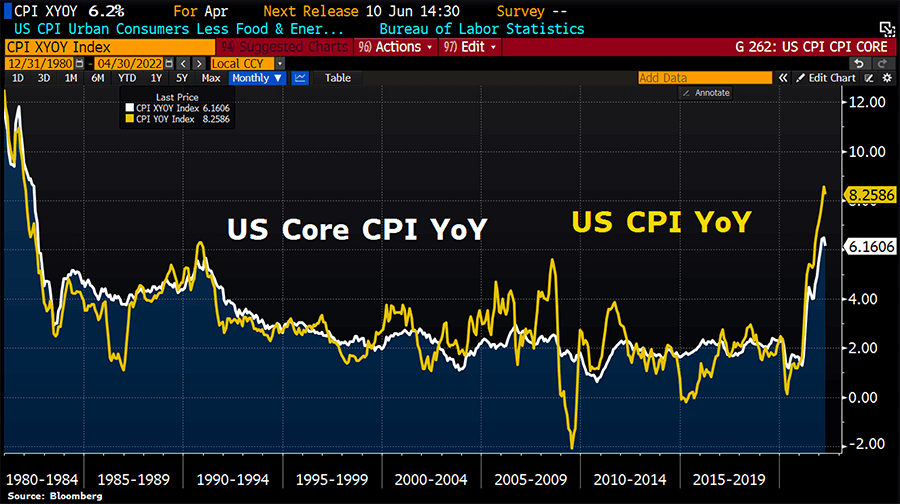
US inflation rate has risen 8.3% year-over-year. Even removing volatile food and energy prices, the so-called core CPI still rose 6.2%.
During the pandemic, governments around the world pumped truckloads of money into their economies to boost the troubled economies.
It was a short-term fix that caused the price to skyrocket.
Why? More money chasing the same amount of goods causes the prices to go up.
The added problem now is that the number of goods did not stay the same.
Due to the supply chain crisis, the amount of goods decreased, thus deepening the inflation.
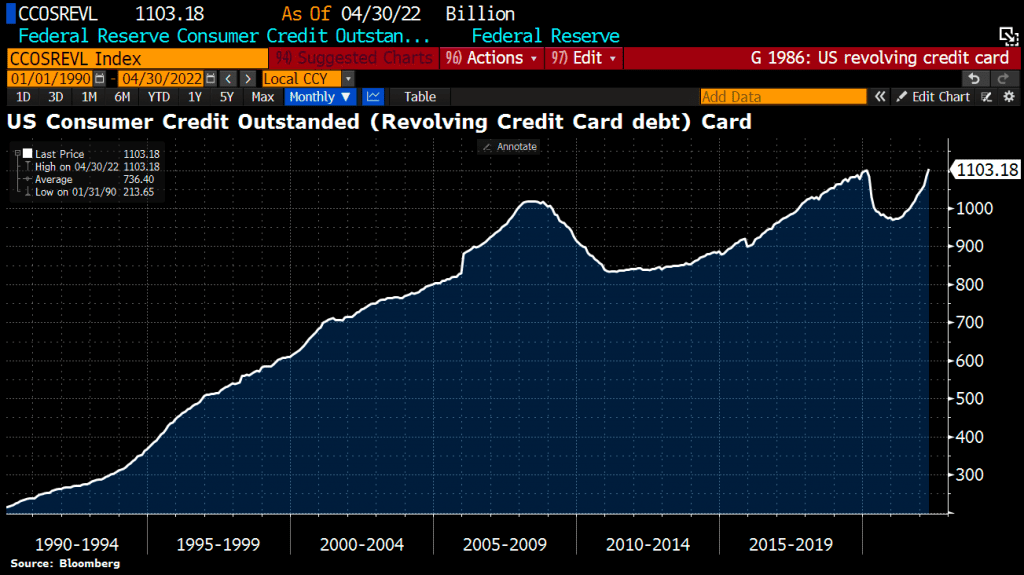
Americans increase credit card usage
In a healthy situation, when the prices start to increase, people start to save money and limit their spending.
What we see in June 2022 is a different picture – Americans dig deeper into credit card debt as inflation continues to rise.
Credit card debt grew by 19.6% compared to a year earlier and totaled $1.103 Trillion in April 2022, surpassing the pre-pandemic record of $1.1tn.
Global debt keeps rising as well
People and companies are diving into more debt all around the world. Total Global debt to GDP hit a record high of 348% in the first quarter of 2022.
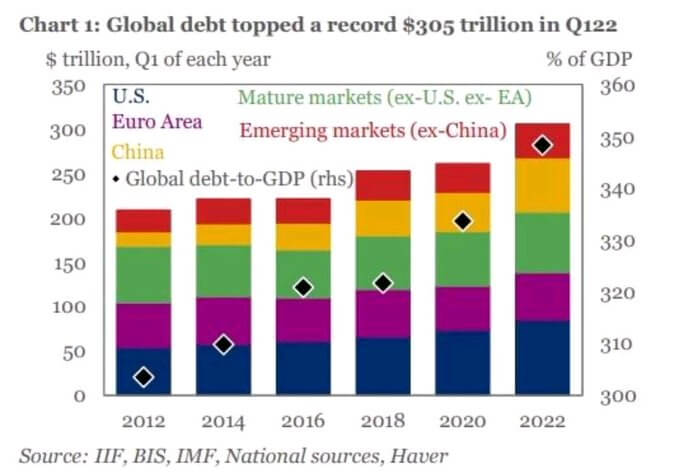
Large and small corporations need more and more debt to produce similar growth rates as they have been used to.
This is another strong signal that the central banks around the world will have to raise the interest rates radically. Unfortunately, by raising interest rates they will also create a recession as small businesses won’t be able to borrow money for growth. Such a combination of high inflation and reduced spending leads to stagflation. Stagflation = inflation + stagnation.
Increased government spending
If the government has trouble paying its bills, it can be forced to borrow more money or increase the money supply through quantitative easing (QE) or other methods.
The latter boosts inflation and makes interest rates drop, which leads to higher asset prices.
If this goes on long enough, it may even lead to an economic crisis—and that’s when you’ll see a stock market crash!
In other words, increased federal spending can lead directly from one thing to another until you end up with a bubble, and then eventually all hell breaks loose as stocks tumble down their respective cliffs into oblivion.
The federal government stimulus program has created an enormous amount of debt and inflation.
The problem with high levels of debt and inflation is that they lead to higher interest rates, lower growth, and even a recession.
That’s right: even if your investments grow 10% per year instead of 5%, your wealth won’t increase very much at all because these investments will be worth much less when adjusted for inflation over time—and who wants that?
Energy crisis
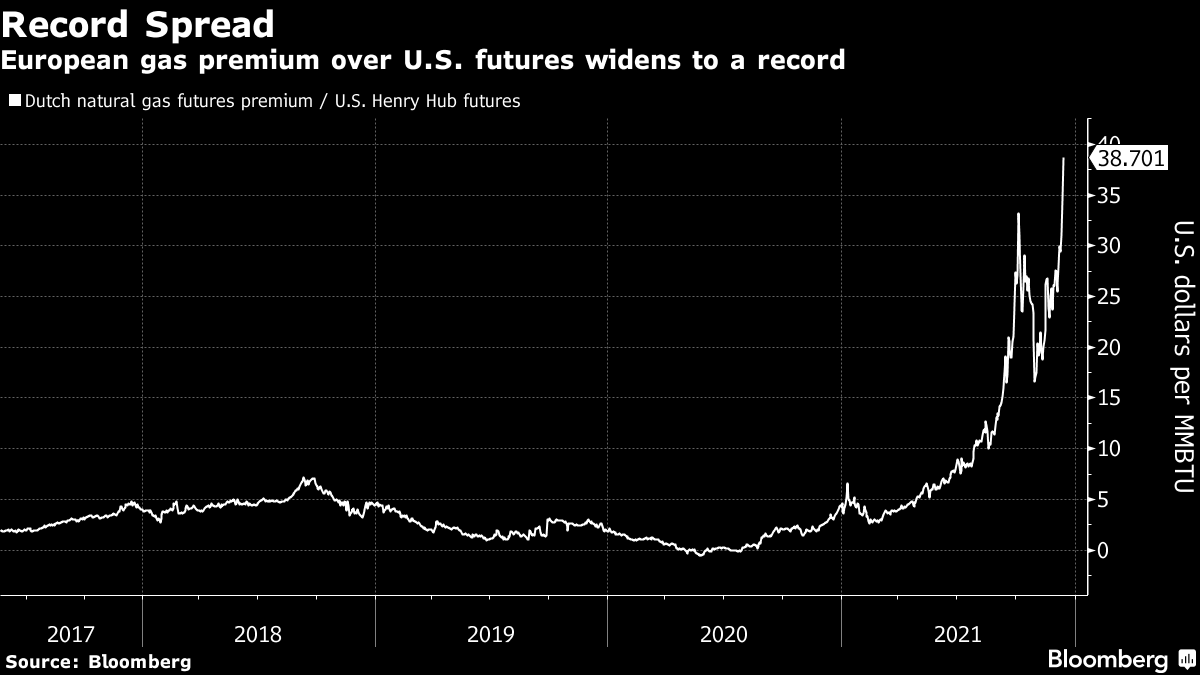
Many countries have adopted new green energy laws…
…which are good for the long-term view, but not so much for the short-term.
For example, Germany has shut down most of its Nuclear power plants with the idea that they will gradually move to renewable energy sources.
Unfortunately, it doesn’t happen so fast. So in the meantime, they have to use coal and gas, thus driving the demand and price for gas up.
Pair it with the fact that China has cut its use of coil and turned to gas (which is significantly cleaner)…
…then add the fact that Russia is cutting its gas supplies to Europe as a form of blackmail…
… And you get the biggest energy crisis we’ve seen for a long time.
The war in Ukraine
Whenever there is a large military conflict or just a threat of one, investors start to move their assets away from stuff like stocks into safer assets like gold or government bonds.
As they sell their tech stocks, the prices of those stocks go down.
The potential war in Taiwan
There have been many signals that China might be considering invading Taiwan already in the autumn of 2022.
Big investors are not waiting for it to happen and are taking out their assets from the stock market before it happens.
Why? Because such military conflict would likely spill out creating a logistical paralysis for all Chinese<>Western goods.
Also because Taiwan is the biggest producer of microchips and a war there would create a shock across all the markets, as everything runs on microchips.
The key takeaway?
The stock market is a game of probabilities. You can’t predict the future, but you can prepare for it.
The market has already fallen quite a bit, but nobody knows how far we are from the bottom before the market turns bullish again.
Predicting the market bottoms is the hardest thing there is.